
Spinning Mills Machine. Finisher Drawing Uster Test. Finisher Drawing Quality Check. Finisher Drawing Diagrams & Spectrograms Faults. Pakspiny
Basic sliver quality check
After the mechanical and visual checks have been completed, basic
sliver checks have to be done using the testing lab equipment to see if the
problem remains. The following can be used as a guideline to systematically
address the quality issues:
Ø Uniformity
Using an evenness tester
obtain the sliver diagram, the spectrogram and the evenness data which includes
CV%. If the drawframe has a leveler, tests should be done with both the leveler
switched “ON” and “OFF”.Compare the ON and OFF results to see if the problems
are similar or if the leveler improves the sliver.
For consistency set the sliver evenness tester to run at 50 m/min:
the maximum scale at + /- 25 %: and the paper speed at 10 cm/min. With this
setting, one cm of paper represents 5 m of sliver, and each heavy horizontal
line is a 5% change.With leveler off, look at the diagram for spikes and
obvious waves.
Ø Sliver spikes
Sliver spikes are normally
created when the roller settings are too close or possibly the break draft is
too low. Check Roller settings and fiber length and reset if necessary. Follow
the recommendations in the machine manual or in the previous section on roller
settings.It is helpful to manually feel the drafting resistance in the break
draft zone. It should be possible to press a feeler gauge into the sliver
between the first two pairs of rollers.
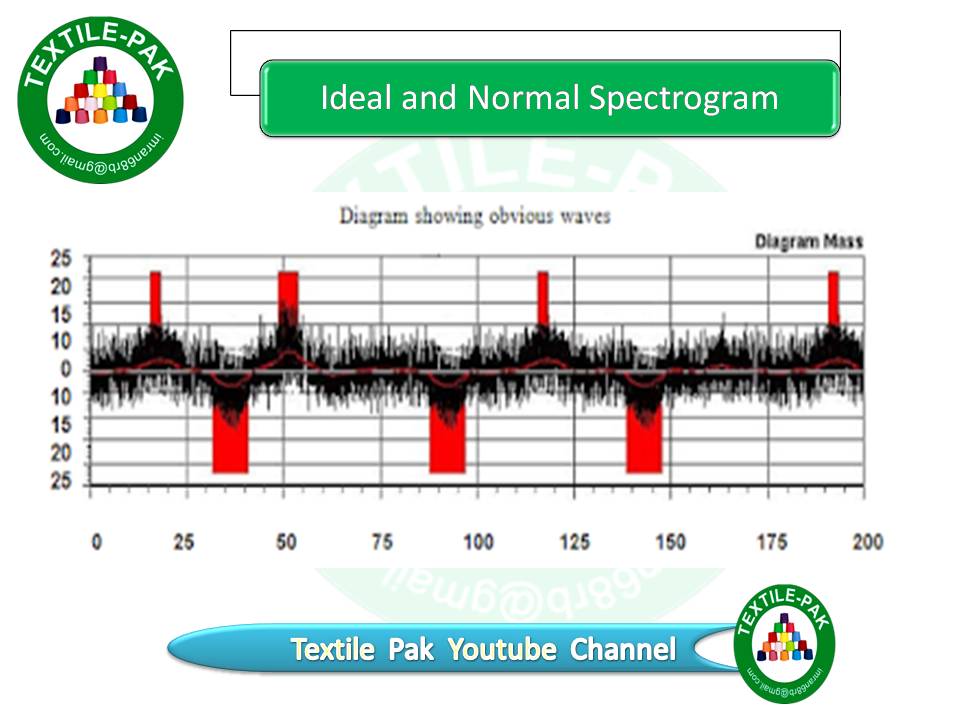
Ø Visible waves in the diagram
Waves that can be obviously seen in the diagram are usually caused
in the previous process or processes
Diagram showing obvious waves
The Spectrogram is most
useful in that it shows where there are periodic faults in sliver, roving or
yarn. There is an Ideal spectrogram for each type of staple fiber, and there is
a “normal” spectrogram form for each process that is slightly different from
the ideal form. In all cases the normal spectrogram should have a smooth shape
from first line at about the 2-cm wavelength, to the second line at about 6 -cm
wavelength. The curve height then gradually reduces, approaching the base line
at the 50-m wavelength.(For man made fibers the normal high point is at a
longer wavelength depending upon the staple length and staple diagram).Sliver
drafting waves extend above the normal spectrogram form and creates a hump. The
hump usually extends from 1.5 to 3 times the staple length with WL of the
highest “mean” point at about 2.25 times the staple length It should be noted
that a drafting wave hump is extended in the spectrogram by any subsequent
drafting action.
For example,
a drafting wave created in
the break draft zone would have a hump mean value of approximately 5 cm, but
which will be extended by the main draft to approximately 25 cm depending upon
the amount of the main draft. Drafting waves are caused by: Uncontrolled fibers
in the drafting zone, Short, floating fibers, Incorrect roller settings,
Insufficient drafting roller pressure, Wrong type of top roller cot Sliver mass
waves are caused by: Stretching the sliver in the process, Wrong type of sliver
funnels or condensers (inside diameter too small), Incorrect Sliver tension in
the coiling action (tension too high or too low).
Ideal and Normal Spectrogram

Main Draft Zone Wave


Break draft zone
Break draft is too low, or
Break draft rollers are too close,

Break draft rollers are too open.

Creates drafting waves in the break draft zone that are then extended by the main draft.
Main draft zone
Drafting waves can be created in the main draft zone by incorrect
roller settings, either too close or too open. The spectrogram can appear
similar in both cases.
Main draft roller distance (HVD) set too close. Staple length of
man made fibers was 38 mm and HVD = 39 mm

- Drafting system pressure
When the drafting system
pressure is not in order, the drafting action is out of control and spectrogram
waves can be seen in the range of 12 to 50 cm. This loss of control can be due
to:
- Insufficient drafting pressure.
Sliver guides incorrectly
located and compacting the slivers on one or both sides. Slivers rolling over
each other prior to entering the draft zone.Undrafted thick places that will be
seen as spikes in the sliver diagram. Leveling action waves Drafting system
pressure Loss of sliver control. The leveling action point has to be carefully
adjusted to function correctly. If the LAP is too early or too late spectrogram
waves will be visible. It is necessary to use the spectrogram when setting the
LAP.
Leveling Action Point “E”
too early.
As an example, the faulty
hump has a high point at a wavelength of approximately 50 cm.
Leveling action point Too
early

Leveling action point “E” too late.Example: The faulty hump has a high point at a wavelength of approximately 30 cm.
Leveling Action Point Too Late

NOTE:
These LAP related spectrogram characteristics could appear if the sliver guides are re-justed or the sliver entry tension is changed. These actions can require a further adjustment of the LAP.
Sliver tension waves.
If the sliver tension, prior to drafting, is too low, th sliver guiding components are not effective. Slivers will roll over each other.ïSpectrogram waves can occur as break draft waves extended by the main draft or as main draft zone waves.Sliver delivery tension waves.If the delivery tension is too high the web being pulled from the delivery rolls is stretched and the sliver becomes uneven. The sliver stretching occurs at the weakest regions that coincide with the dominan drafting waves. The effect is to amplify the wave form rather than to extend the wavelength.
Coiler tension waves
If the coiler speed is not correct, the sliver will either be folded when it is too low, or it will be stretched when it is too high. When the coiler speed is too low and sliver folding occurs Spectrogram waves can be seen in the range of 1.5 to 3 cm.

This
characteristic is very evident in combed cotton.These waves can be confused
with main draft zone waves.
Spectrograms of mechanical and periodic
faults.
Coiler
Speed Corrected Combed Cotton 35 mm Mechanical faults create sliver mass
irregularities that can be seen in the spectrogram as falling into one or two
adjacent channels. These are sometimes referred to as “chimneys”. A mechanical
fault creates a defect that is then extended or drafted out by the drive
mechanisms or
by
the drafting action. By considering a specific spectrogram wavelength, the
gearing layout and the change gears used, it is possible to limit the possible
causes to one or two elements.Many periodic faults show up as a spectrogram
peak at a wavelength WL, but in addition, one or more peaks are visible as
harmonics. These harmonic wavelengths are usually at WL / 2, WL / 3, WL /4 ….
When multiple peaks are visible with this relationship, the true wavelength is
the longest one.
Draft roller defects
The following guidelines are:
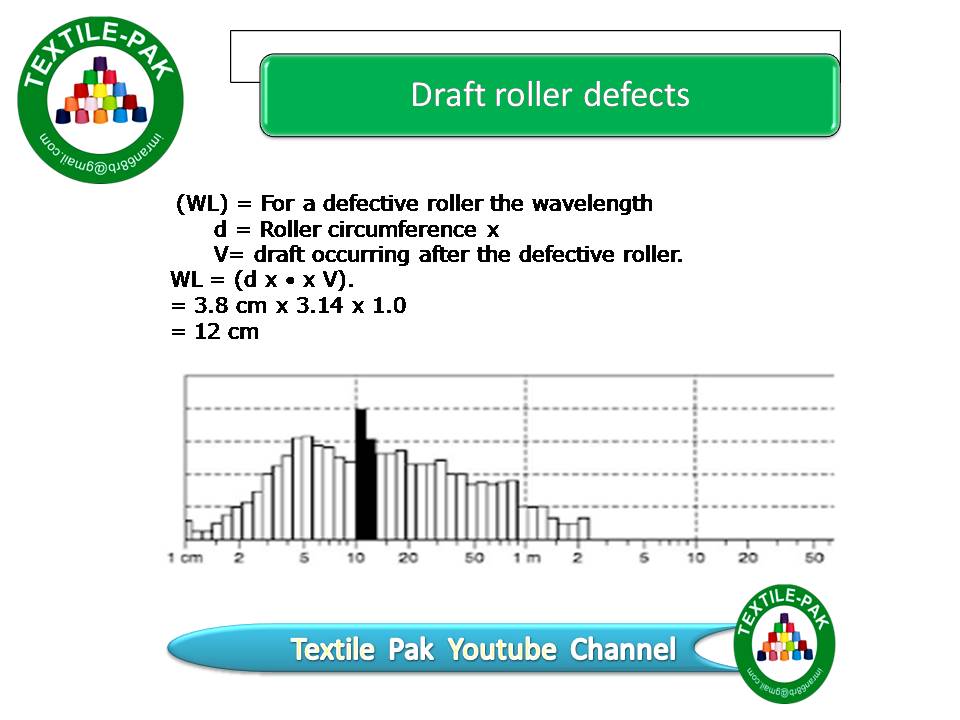
Front Top Roller, Out of Round
If a roller is oval, the high and low places
occur twice each revolution and the WL in the spectrogram will then be

If the top roller cot-surface is defective the defect can show up as a 12 cm or a 6 cm peak.

Front Top Roller, Oval Shaped
Periodic faults of coiling and can filling
Trash accumulation in the coiler tube or a mechanical defect in the coiler
head can cause spectrogram spikes at the wavelength corresponding to
circumference of the coil. (WL = Coil diameter x 3.14 cm) The spikes
at the harmonics can also be visible.
False coiler peak


No comments:
Post a Comment